AgScan3D Viticulture
Notes on the Dataset
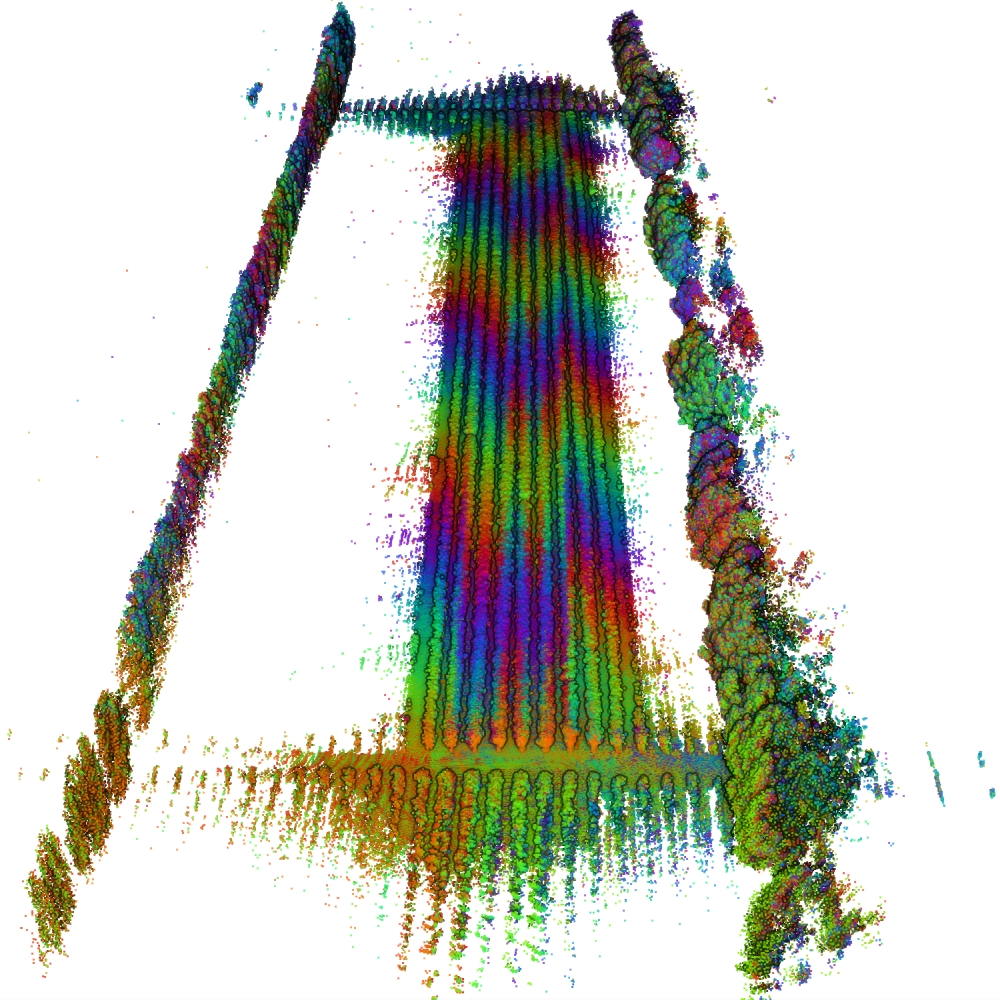
- The data is represented as ray clouds, storing the origin of the laser in addition to the surface point. To convert the ray cloud into a point cloud, all points with alpha=0 (rays that did not hit anything) have to be discarded.
- Only a small subset of the originally acquired dataset is released. Within this subset only some rows were scanned multiple times.
- For Rymill_b13_r27_to_r33, two PLY files for the same raw data exist. One contains the ray cloud, the other one a derived point cloud with the ray direction stored as normal values.
Detailed Information
| General Information | |
| Name | AgScan3D Viticulture |
| Release Year | 2021 |
| Terms of Use | CC BY-NC-SA 4.0 |
| Access Requirements | Agree to terms of use |
| Dataset Size | 26.2 GB | Partial download is possible, i.e. the data is split into several files (e.g., epochs or data types) |
| Documentation | Multi-paragraph description of the dataset, e.g., in the form of a paper section or a comprehensive readme file |
| Code | Yes |
| Applications | Vegetation mapping and monitoring |
| Detailed Applications | Canopy density monitoring in viticulture |
| Acquisition | |
| Number of Scenes | 5 |
| Number of Epochs per Scene (minimum) | 2 |
| Number of Epochs per Scene (median) | 2 |
| Number of Epochs per Scene (maximum) | 3 |
| General Scene Type | Agriculture |
| Specific Scene Type | Vineyard rows |
| Location | McLaren Vale (Australia) / Coonawarra (Australia) |
| Acquisition Type | Mobile laser scanning |
| Acquisition Device | Spinning SICK LMS511-20100 |
| Acquisition Platform | Kubota farm vehicle |
| Scan Interval | Weeks |
| Acquisition Months | Janurary: 0 February: 0 March: 0 April: 0 May: 0 June: 0 July: 0 August: 0 September: 0 October: 4 November: 3 December: 5 |
| Representation | |
| Data Representation | Unstructured, globally aligned (e.g., point cloud or ray cloud) |
| Specific Data Representation | Ray cloud |
| File Format/Encoding | PLY |
| Raw Data | ROS bags |
| Additional Data | - |
| Coordinate System | m |
| Quality and Usability | |
| Registration | Coarsely registered |
| Number of Partial Epochs | - |
| Unusable Data Reason | Not multi-temporal |
| Splits | No |
| Per-Point Attributes | |
| Intensity/Reflectivity | No |
| Color | No |
| Semantic Labels | - |
| Instance Labels | No |
| Change Labels | - |
| Statistics | |
| Number of Points per Epoch (minimum) | 15M |
| Number of Points per Epoch (median) | 19M |
| Number of Points per Epoch (maximum) | 25M |
| Avg. Point Spacing (minimum) | 2.1cm |
| Avg. Point Spacing (median) | 2.8cm |
| Avg. Point Spacing (maximum) | 3.0cm |
| Avg. Change Points per Epoch | - |
Paper Reference 1
@article{lowe2021canopydensityestimation,
    author = {Lowe, Thomas and Moghadam, Peyman and Edwards, Everard and Williams, Jason},
    title = {Canopy density estimation in perennial horticulture crops using 3D spinning lidar SLAM},
    journal = {Journal of Field Robotics},
    volume = {38},
    number = {4},
    pages = {598--618},
    keywords = {agriculture, LiDAR mapping, perception, SLAM},
    doi = {10.1002/rob.22006},
    year = {2021},
}
Dataset Reference 1
@dataset{lowe2021datasetagscan3d,
    author = {Lowe, Tom and
                  Moghadam, Peyman and
                  Edwards, Everard and
                  Williams, Jason and
                  Brosnan, Stephen and
                  Haddon, David and
                  Dungavell, Ross},
    title = {AgScan3D Viticulture Datasets. v1.},
    year = {2021},
    publisher = {Zenodo},
    doi = {10.25919/gbvy-yz23},
}